Neuroreader® Brain Volumetric Report Reduces Time to Diagnosis
Report generation timing is essential for workload, workflow optimization and for prompt diagnosis in clinical settings. On average, US radiologists typically spend around 24 minutes reviewing a brain MRI and drafting a report [1,2]. That said, Neuroreader® reduces the time required to read an MRI from 24 minutes down to 10 minutes or less (by a cloud-based data analysis computer program). With advanced deep learning techniques, the computer program can visualize and quantify a large number of brain structures. Neuroreader® objectively analyzes DICOM images from MRI brain scans by comparing the patients brain volumes against a normative database with people of similar age, gender and head size. It measures and identifies atrophies of brain structures, such as the hippocampus, lateral ventricles, and brain lobes.
Gain 50% more time with Neuroreader®
Neuroreader® reduces the read times from approximately 24 to 10 minutes, which ultimately means 14 minutes per scan. While on average, a hospital performs 16.6 – 27 patient brain MRI scans per day [3,4], this means that Neuroreader® saves the radiologists at least 232,4 minutes to 378 minutes per day. This statistic reflects that approximately 58.33% of the radiologists’ time have been reduced by using Neuroreader®, in comparison to radiologists who are unassisted by automation in the trial.

Neuroreader® helps reduce the time leading to diagnosis with 20 months
To study complex neurodegenerative diseases which involve atrophy of various brain structures, such as Alzheimer’s Disease, where a structural MRI visualizes the complete brain and is relatively sensitive to any changes in brain volume are essential [5], it can take about 20 months (European average) to get to a firm diagnosis due to the low prediction accuracy (60-80%) of current neurological assessments [6], while the same assessment by Neuroreader® is done in 10 minutes.
FACTS
Success in clinical decision-making depends on highly accurate results – and not least speed, when
attempting to detect the fine volume changes seen at the earliest stages of neurodegenerative
diseases.
As accurate as the gold standard – manual vs automated segmentation
Often, when discussing controls of cognitive impairment and neurodegenerative diseases in general, the dissimilarity coefficients are very high, typically around 88%. This number typically holds across all types of cognitive decline. The reason why that is important is that if comparing the automated volumetric segmentation with Neuroreader® to the so-called gold standard anatomical segmentation by an expert anatomist, there is a high degree of agreement between the two methods. Except with volumetrics, you have a very high, thorough, and accurate segmentation in a short time-period, as hand drawn, manual segmentations typically take a lot longer. [7] This ultimately means that the speed of clinical decision-making is a lot faster when using an automated volumetric segmentation method like Neuroreader®, resulting in earlier diagnosis, adequate, and faster patient care.
Manual Segmentation
Currently, manual tracing of brain regions – especially the hippocampus – is considered the “gold standard” for volumetric
quantification and is a crucial component of early
detection of neurodegenerative diseases.
Such work typically requires a trained tracer with anatomical knowledge of the hippocampus to hand-draw its borders on successive coronal sections and can take even an experienced physician anywhere from 30 minutes to 2 hours per patient.

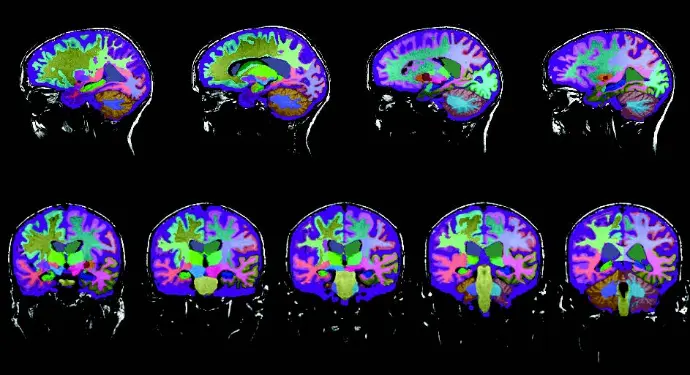
Automated Segmentation
With automated volumetric data of brain MRI, you gain insights where the atrophy is occurring in the brain, which specific brain regions are affected, and which are not, as well as the magnitude to which they are affected. Furthermore, it gives us information about the progression. In comparison to manual hippocampal tracing, Neuroreader® can compute the volume of the hippocampus in less than five minutes and multiple structures of the entire brain in less than 10 minutes.
In comparison to manual hippocampal tracing, Neuroreader® can compute the volume of the hippocampus
in less than five minutes and multiple structures of the entire brain in less than 10 minutes.
References
- Duong MT, Rauschecker AM, Rudie JD, et al. Artificial intelligence for precision education in radiology.
Br J Radiol. 2019;92(1103):20190389. doi:10.1259/bjr.20190389. - Al Yassin A, Salehi Sadaghiani M, Mohan S, Bryan RN, Nasrallah I. It is About “Time”: Academic Neuroradiologist
Time Distribution for Interpreting Brain MRIs. Acad Radiol. 2018 Dec;25(12):1521-1525.doi:10.1016/j.acra.2018.04.014. PMID: 29929936. - Sartoretti, Elisabeth et al. “Reduction of procedure times in routine clinical practice with compressed
SENSE magnetic resonance imaging technique”. PloS one vol. 14,4 e0214887. 12 Apr. 2019,doi:10.1371/journal.pone.0214887. - https://www.usa.philips.com/healthcare/education-resources/publications/fieldstrength/three-morepatients-per-day-compressed-sense-knc
- Frederik Barkhof, Marieke Hazewinkel, M. B. and R. S. Dementia – Role of MRI. 2012 Available at: https://radiologyassistant.nl/neuroradiology/dementia/role-of-mri (Accessed: 7th De-cember 2020)
- https://www.quantib.com/blog/advancing-alzheimer-mris-using-ai-quantitative-imaging?fbclid=IwAR0MXTawsVC-D9tUxyTOG1VJ3AhQn0b2rZSGsa9qrUSlgTTpD-clOnzp-n8
- https://content.iospress.com/download/journal-of-alzheimers-disease/jad150559?id=journal-of-alzheimers-disease%2Fjad150559
Do you want to know more about our software?
Fill out the form below and we will get back to you as soon as possible.